When AI can't help my task initiation issue.
Mon Nov 02
I have two major problems in my life.
One is Idiopathic Hypersomnia, which is a rare sleep disorder1 that causes excessive sleepiness throughout the day, regardless of the quality of the nighttime sleep. A basic human function like staying awake becomes a challenge. I sometimes be in a “walking sleep mode”, literally walking like a zombie half asleep.
Even getting out of bed to start my day is difficult for me, despite being a morning person who naturally wakes up without an alarm. But the most difficult symptom to manage is the post-meal sleepiness. Before I got a diagnosis in my early 30s, I used to be coding websites half asleep until I felt a little better around 17:30 (an hour before leaving the office), even though I finished eating lunch by 12:30.
The other is Autism Spectrum. I have a sticky brain, which has difficulty switching focus from one task to another, particularly because it attaches too intensely to the current activity or topic. I don’t forget the time, but I often find myself unconsciously snoozing alarms multiple times, then forget how I wanted to limit the time for this activity.
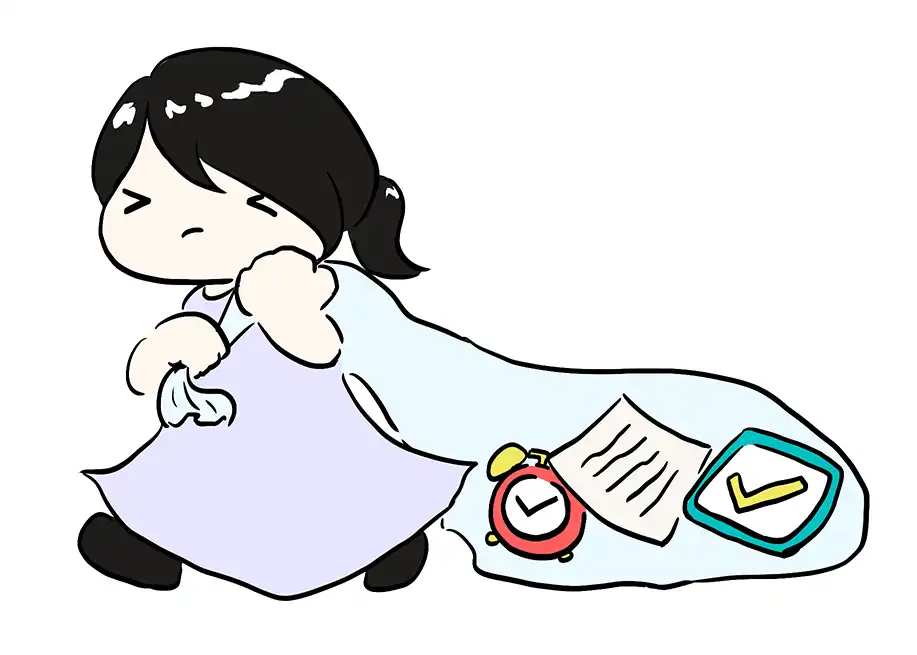
This difficulty is called Executive Dysfunction, which is also related to Hyperfocus, a deep and also narrow-focused state. 2 To simplify the point, an autistic brain requires an extra effort to break the focus.
Obviously, the functional issues become much harder when this trait is combined with the sluggishness of Idiopathic Hypersomnia.
What I needed
The term idiopathic means “The cause is unknown”. When the cause is unknown, there is no real treatment. Symptoms are also varied. Some sleep over 11 hours at night, while others have normal nighttime sleep duration (7-9 hours), and we don’t know why.
Autism is another mystery. Researchers have just discovered over 1,500 unreported protein-protein-interaction network related to autistic genes. We still don’t know much about how neurodivergent brains work.
Both create a social stigma around the symptoms or traits. Idiopathic Hypersomnia is hardly recognized, and the sleepiness is often misunderstood as laziness. Autism is a neurological disorder, but it’s categorized as a mental disorder (at least in Japan) with weirdo characteristics.
But anyway, I have to live with my conditions. Aside the hypersomnia medicine I take, what I can do to help myself is to stabilize my condition as much as possible by understanding better about my biological traits. For this, a sleep diary and a daytime sleepiness log are very useful.
Unfortunately, no AI can help for this
By the way, the most common advice for the friction issues is to lessen them.
- Break a big project into smaller tasks.
- Use reminders.
- Carry a pocket notebook to keep your ideas, or use voice notes if you’re an auditory person.
- Ask AI to help your functionality.
I agree, they work. But at the same time, they all need your cognitive operation.
My problem is that when I’m too sleepy, I’m not conscious enough to do any of this. I sometimes feel as if I’m looking at the world from a humanoid cockpit as a passenger, not as a pilot. 3
Unfortunately, there is no way to let a device read my mind and input/output things on my behalf in 2026. AI can’t help my hypersomia-involved executive functioning. So, what exact thing to do instead?
What I did and How
No perfect solution, but lessen the frictions, anyway (objective)
Well, my solution was super simple. “Just use Apple Shortcuts” to remove the frictions.
Grab a smartphone, unlock it, find a desired app icon, tap it to open, find a field to log, and input… It costs too much of my cognitive energy under a sleep attack. So, let’s minimize the number of required steps.
Speaking about the cognitive demands, what about an analog method? Yes, an analog method is what’s often encouraged by productivity people, and I personally prefer a paper notebook for quick logging. But unfortunately, an analog method makes no difference when it comes to recording things under a sleep attack. Take a notebook, grab a pen, open a target page… Then I can finally log things. This is too much for an almost unconscious brain.
Plus, analyzing analog data has limitations on fetching and sorting specific data on demand.
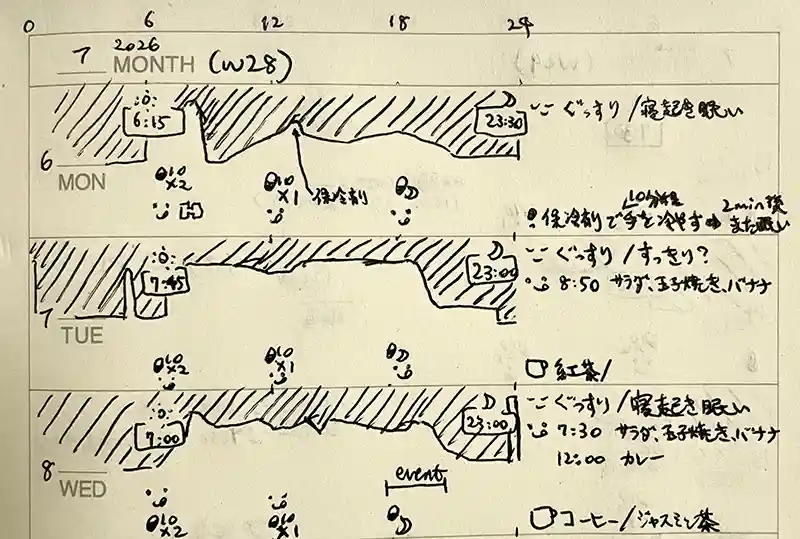
I believe A6 is the best size to take meaningful notes without sacrificing portability. Unfortunately, this format became too small, as I got many more things to log with time.
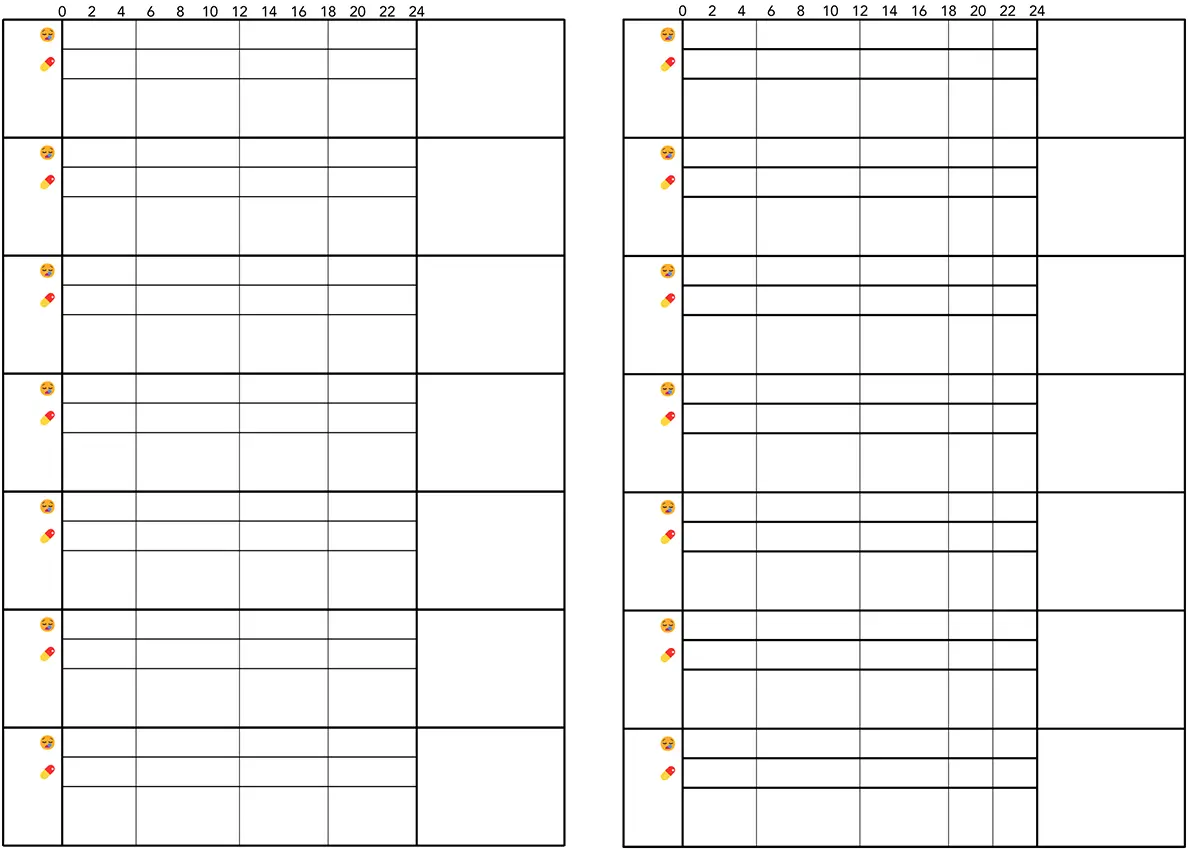
I made a printable version as well.
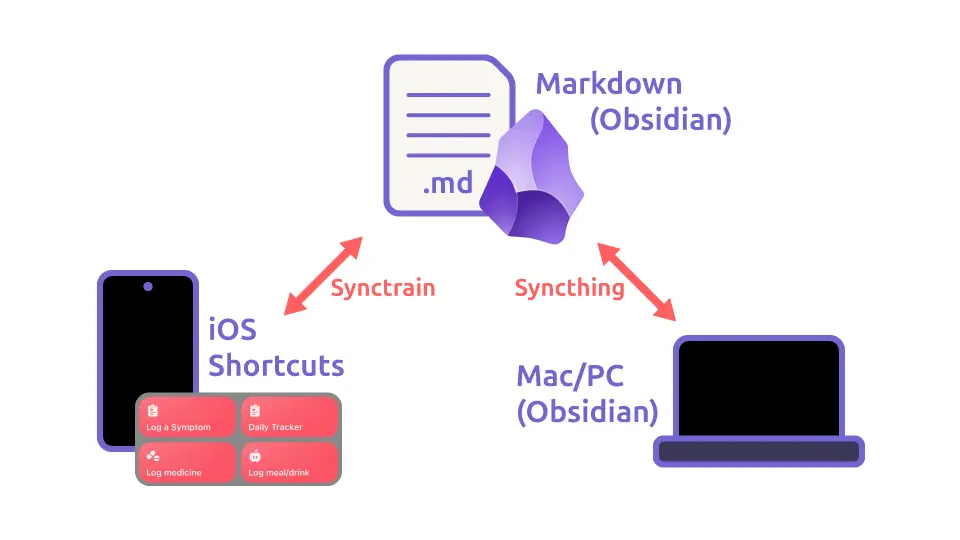
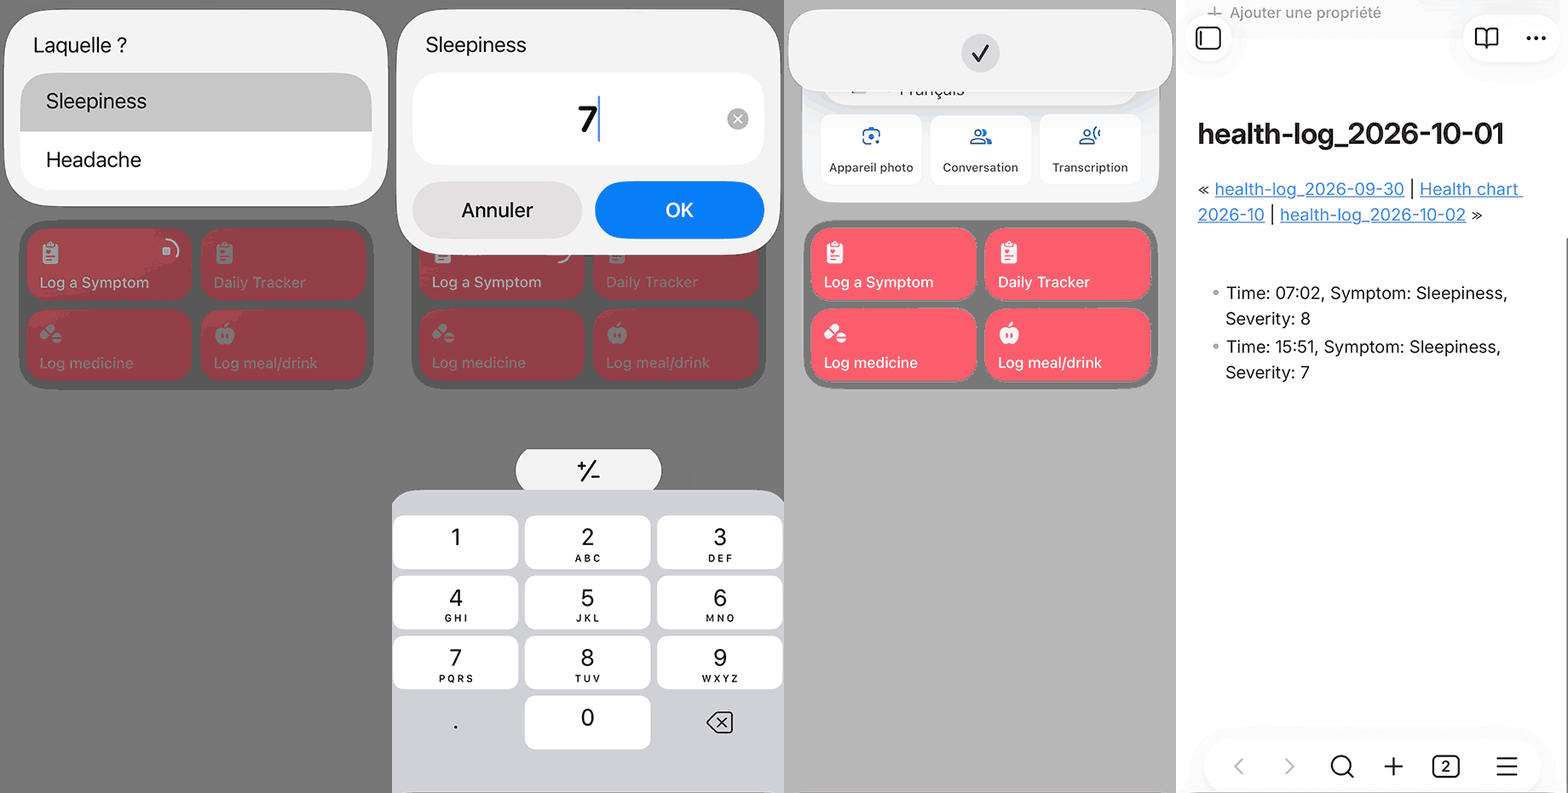
So, this is what I planned instead: Grab my iPhone, swipe left to open the widget area, hit a shortcut, enter data. The shortcut widget logs what’s input to my Obsidian vault. This way, I don’t even have to unlock my phone.
1. Obsidian as a logging platform
I chose Obsidian, a markdown-based note-taking app as a logging platform.
The biggest reason why I chose this was that Markdown is a universal format. It will be relatively easy to migrate the data when I decide to use a different system.
The Sync feature is also important. A smartphone is convenient for quick tasks, but the screen is too small to see the full picture. And I prefer to set things up on a computer because my typing speed is 100x faster with it. Fortunately, Obsidian syncs with all the devices that I own. 4
And, I use Obsidian every single day. Having a logging system in the app I use daily can also decrease cognitive load, thanks to the muscle memory. I will have less chance of forgetting where the data is stored, which can be helpful when I try to show it to my doctor during a sleep attack.
On top of that, I’m a huge markdown lover.
2. Widgets
I set up iOS widgets via Shortcuts to log the following data by category.
- Symptoms
- Daytime sleepiness severity
- Headache severity
- Medication
- Medication time, type and quantity
- Daily Tracker
- Wake-up time
- Bed-in time
- Meals I ate and the time of eating
- Activity duration (e.g., workout)
3. The charts
The input data will be stored in /Health Log/health-log_YYYY-MM-DD.md of my Obsidian vault. I log my symptoms throughout the day, and, at the end of the day, my daily log will look like this.
---
WakeUp: 07:00
BedIn: 22:05
---

# health-log_YYYY-MM-DD.md

- Time: 07:00, Symptom: Sleepiness, Severity: 8
- Time: 07:30, Med: IHmed, Severity: 2
- Time: 09:00, Symptom: Sleepiness, Severity: 5
- Time: 12:00, Meal: Curry and rice
- Time: 12:30, Med: IHmed, Severity: 1
- Time: 12:30, Symptom: Sleepiness, Severity: 6
- Time: 13:00, Caffeine: Coffee, Severity: 1
- Time: 15:00, Symptom: Sleepiness, Severity: 4
- Time: 16:00, Symptom: Fatigue, Severity: 5
- Time: 17:00, Symptom: Headache, Severity: 2
- Time: 17:20, Med: Painkiller, Severity: 1
- Time: 20:00, Symptom: Sleepiness, Severity: 6
- Time: 22:00, Med: InsomniaMed, Severity: 2
Descriptions about the severity numbers:
- Severity levels for Idiopathic Hypersomnia (1 - 10)
- 1 = Almost not sleepy at all
- 5 = Moderately sleepy, but I can stay functioning
- 8 = Walking like a zombie
- 10 = Taking a nap
- Severity count for others
- IH med (Hypersomnia medicine): Number of tablets
- InsomniaMed (Insomnia medicine): Milligrams
- Caffeine: Cups (1 cup = ~250ml)
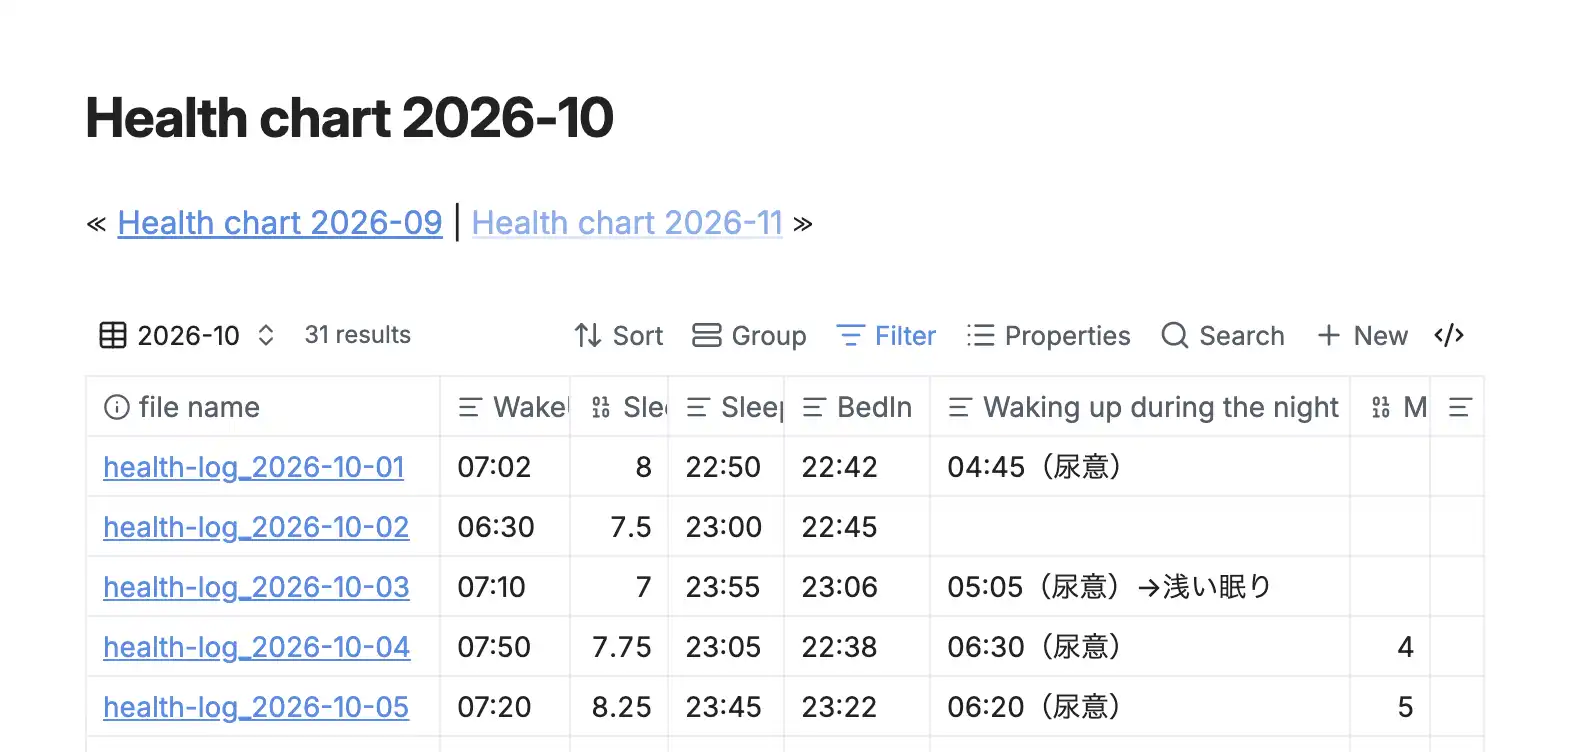
In the same folder, I set up Health chart_base.base to visualize daily bedtime and menstruation as a table, and Health chart YYYY-MM.md for daily charts to analyze the correlations between my sleepiness and other activities (I’ll show the final code later in this article).
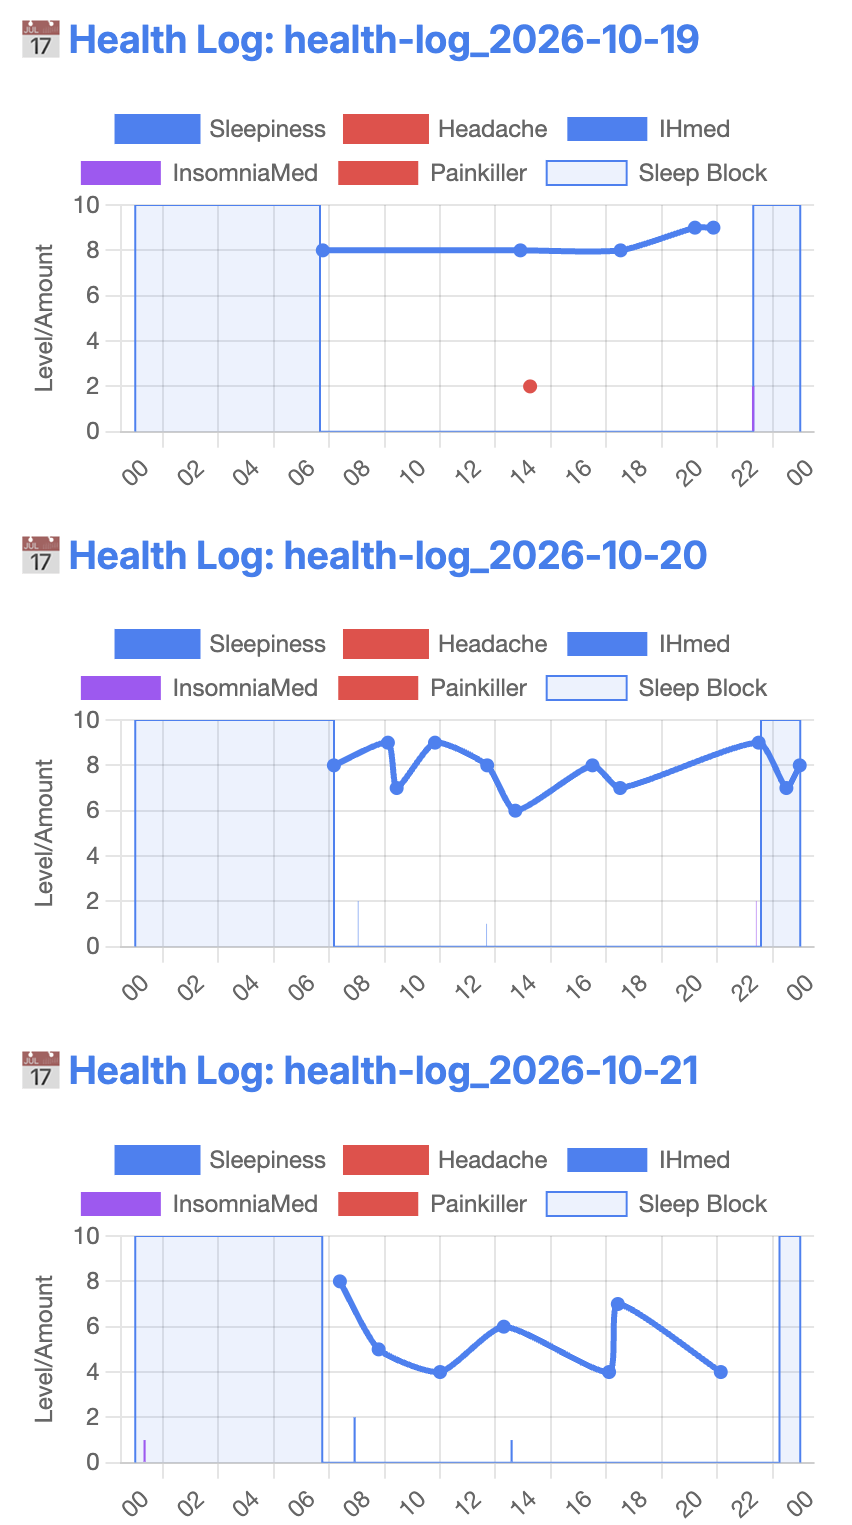
For the charts in Health chart YYYY-MM.md, I used two plugins: Dataview and Charts.
Dataview is one of the most popular Obsidian plugins, and I’m used to writing snippets with it. No problem.
On the other hand, the Charts plugin was… To be honest, too difficult to configure. The plugin was obviously made for advanced users who just get the unexplained parts of the “quick note” type documentation. Fortunately, there were better explanations for ordinary people in Chart.js (what the plugin was based on) and the Dataview (it handles the daily log integration I needed to implement) documentations.
But shamefully, my scripting skill wasn’t enough. At the end of the day, I had to rely on Google Search (AI mode). There, I encountered another problem: The inaccuracy of the AI’s outputs.
There were 3 or 5 (or more) Obsidian plugins that have “Charts” in their names. The AI mode’s Gemini suggested one plugin and advised me to use another plugin’s snippet code… Man, this Charts plugin doesn’t even have a scripting feature…
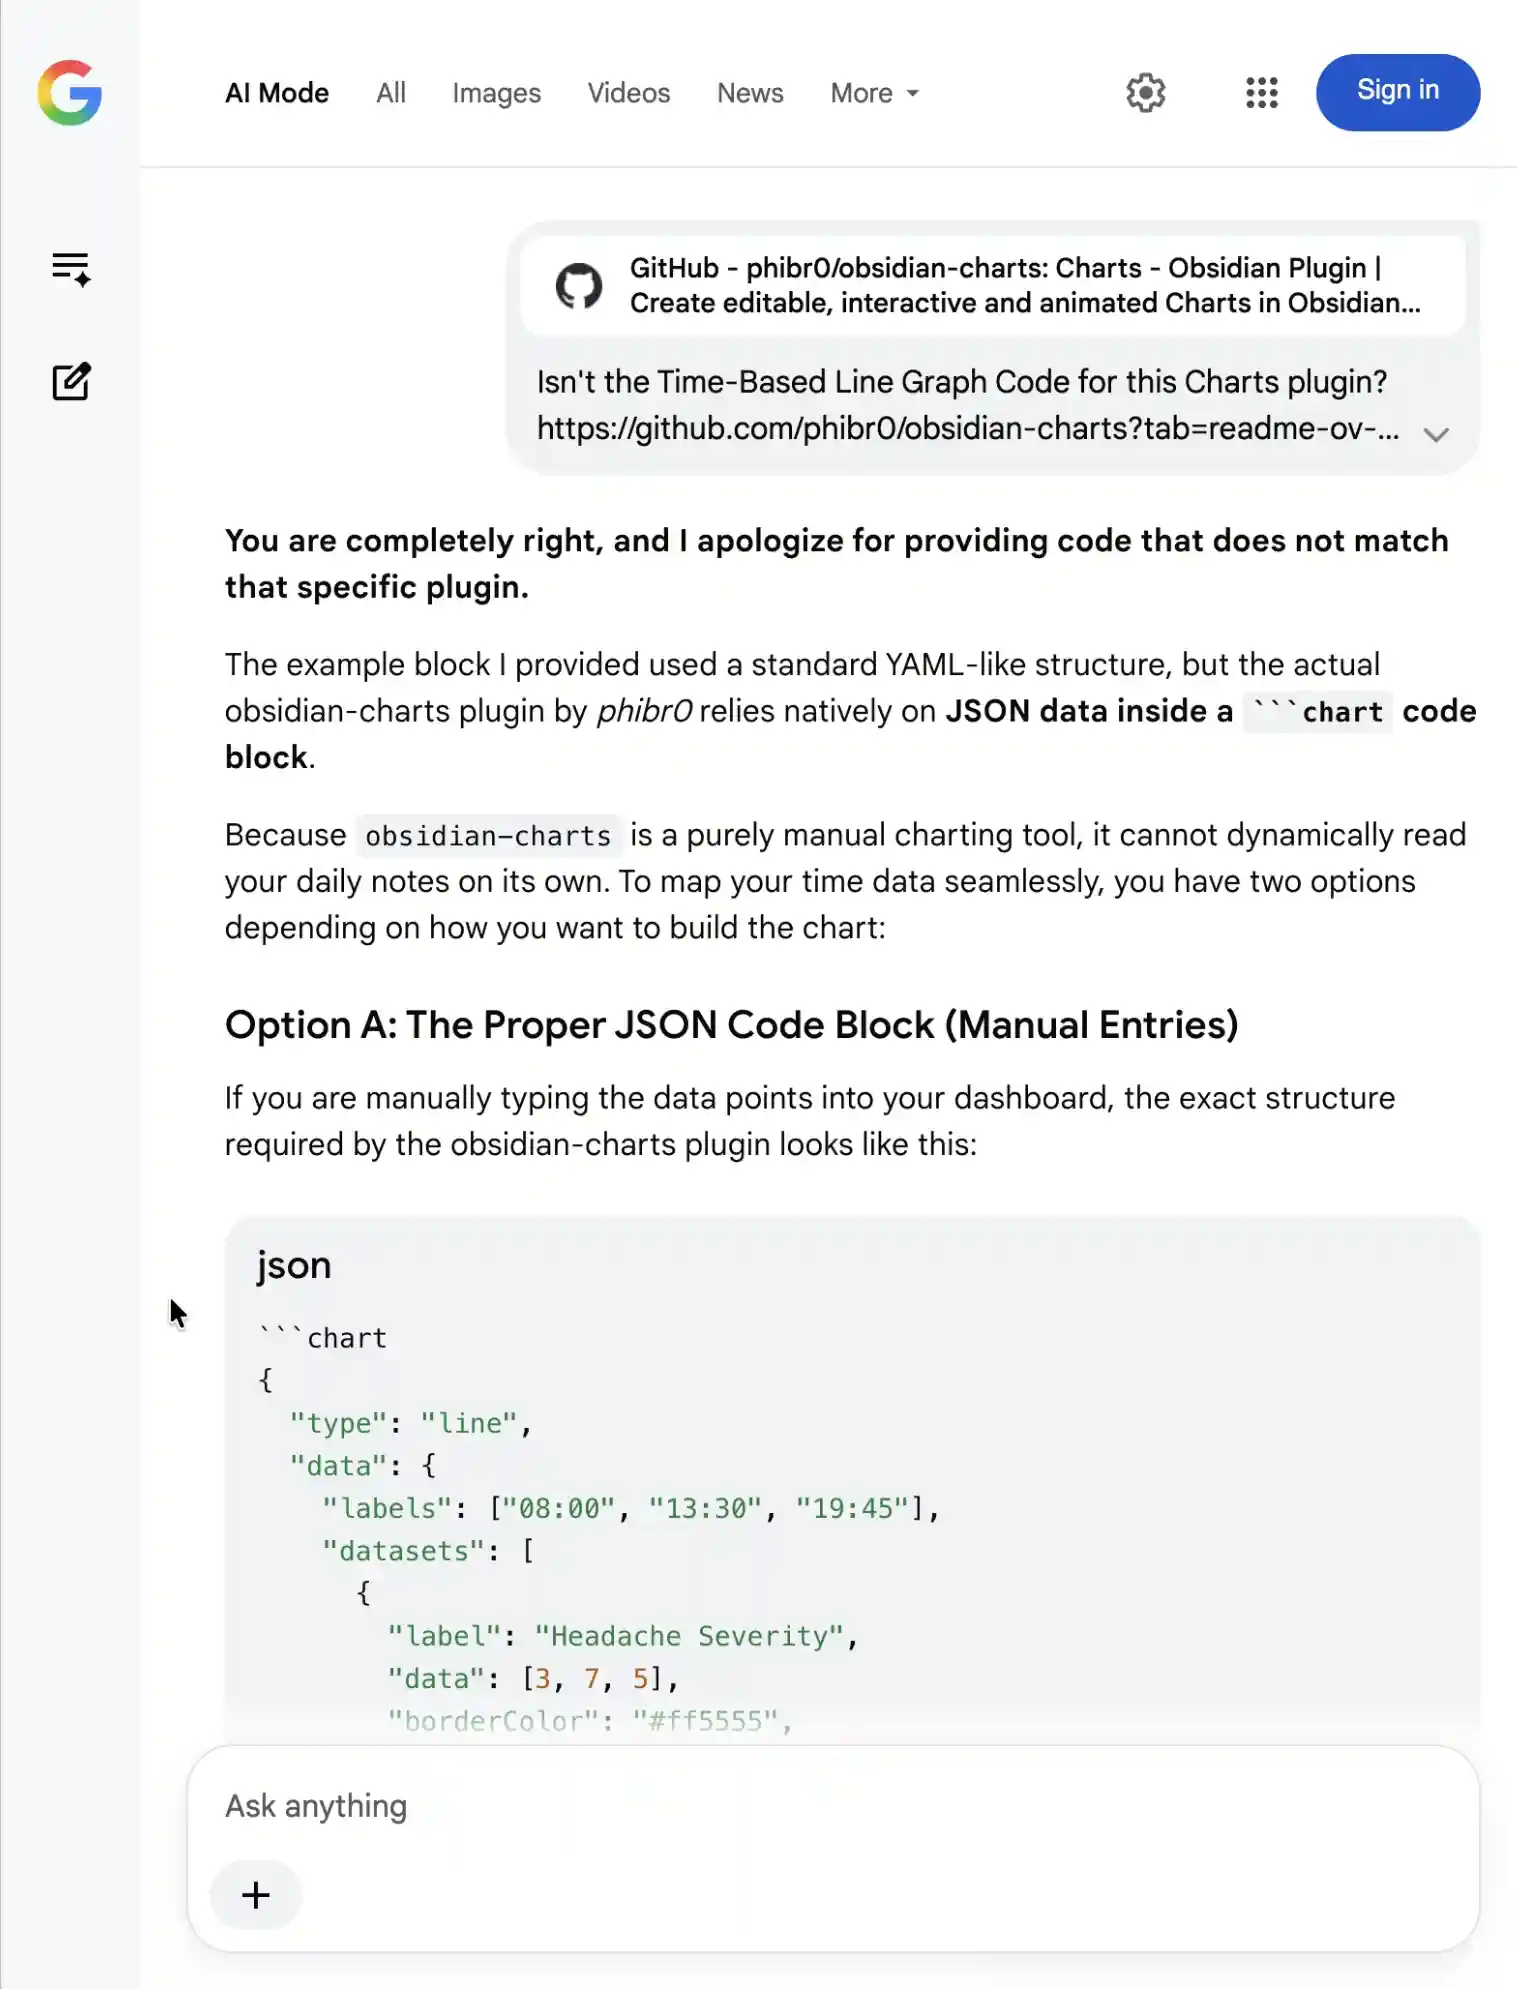
But, despite the challenges I faced with the free Gemini, it did a job after a few iterations. I was happy with the final output. At least, now I have a system to start testing.
3. Now and Then (3 months later)
It’s been 3 months since I did this setup. I’ve had a few changes with the setup, and also with my quality of life.
How I use it in a day
Whenever I feel sleepy, detect a headache, or notice the symptom has gone, I hit the “symptoms” widget without unlocking my phone. I do the same when I take a medicine.
Of course, there are days I forget to log anything because of a packed schedule or a hyperfocus that lasted for hours, and it’s fine. Not only because overall consistency is much more important than perfection, but also the absence of records can be a sign of dysregulation to pay attention to.
Then, at the end of the day, I record my bed-in time with a widget. When I wake up, I record my wake-up time with a shortcut, then I open Obsidian to manually record the time I actually fell asleep, the time I woke up in the middle of the night, and the last night’s sleep duration. This morning session has to be done by hand for two reasons. For better accuracy, and to reflect on my recent evening behaviors.
How it’s helping me
I noticed the effortless logging system allowed me to check in with my symptoms more frequently than ever. Whether I’m walking in a busy street or working in an office (be mindful about the social courtesy, tho!), I don’t have to mind where and when I launch the widgets because the logging takes only a few seconds, anyway.
The customizability of digital chart is very useful, especially when I want to analyze a specific type of data before I meet my sleep doctor. Now it’s easier to list talking points.
What’s changed
I modified a few things to fit more of my needs.
From the chart, I removed several data types to improve the loading speed, such as
- Fatigue
- Meal
- Activities (workout, walking, focus)
This also removed the labels on top of the charts, which created visual clutter on the tiny screen of my iPhone 12 mini.
By the way, removing these data types from charts didn’t mean I stopped recording them entirely. For example, I removed the meal section from the chart because I found out that what I ate affects the daytime sleepiness severity much more than when I ate. If I notice severe post-lunch sleepiness has become persistent, I can either look into daily logs or add the meal data type to the chart to see if there is a new trend.
After decluttering, I simplified the color scheme by applying the same color for related data types.
- Blue for Idiopathic Hypersomnia-related data: Sleepiness severity, sleep block (bedtime duration), and medication
- Red for headache-related data: Headache severity and painkiller intake
- Purple for insomnia-related data: medication
To the Dataview table, I added a few more columns to understand my nighttime sleep patterns after my doctor found probable chronic insomnia. 5
- SleepIn (Based on my memory)
- Waking up during the night (Typically to go to the toilet…)
- Sleep Hours (Hours in between SleepIn and WakeUp - night time wake-ups)
- Menstruation (quantity 1-5)
- Note (To record details)
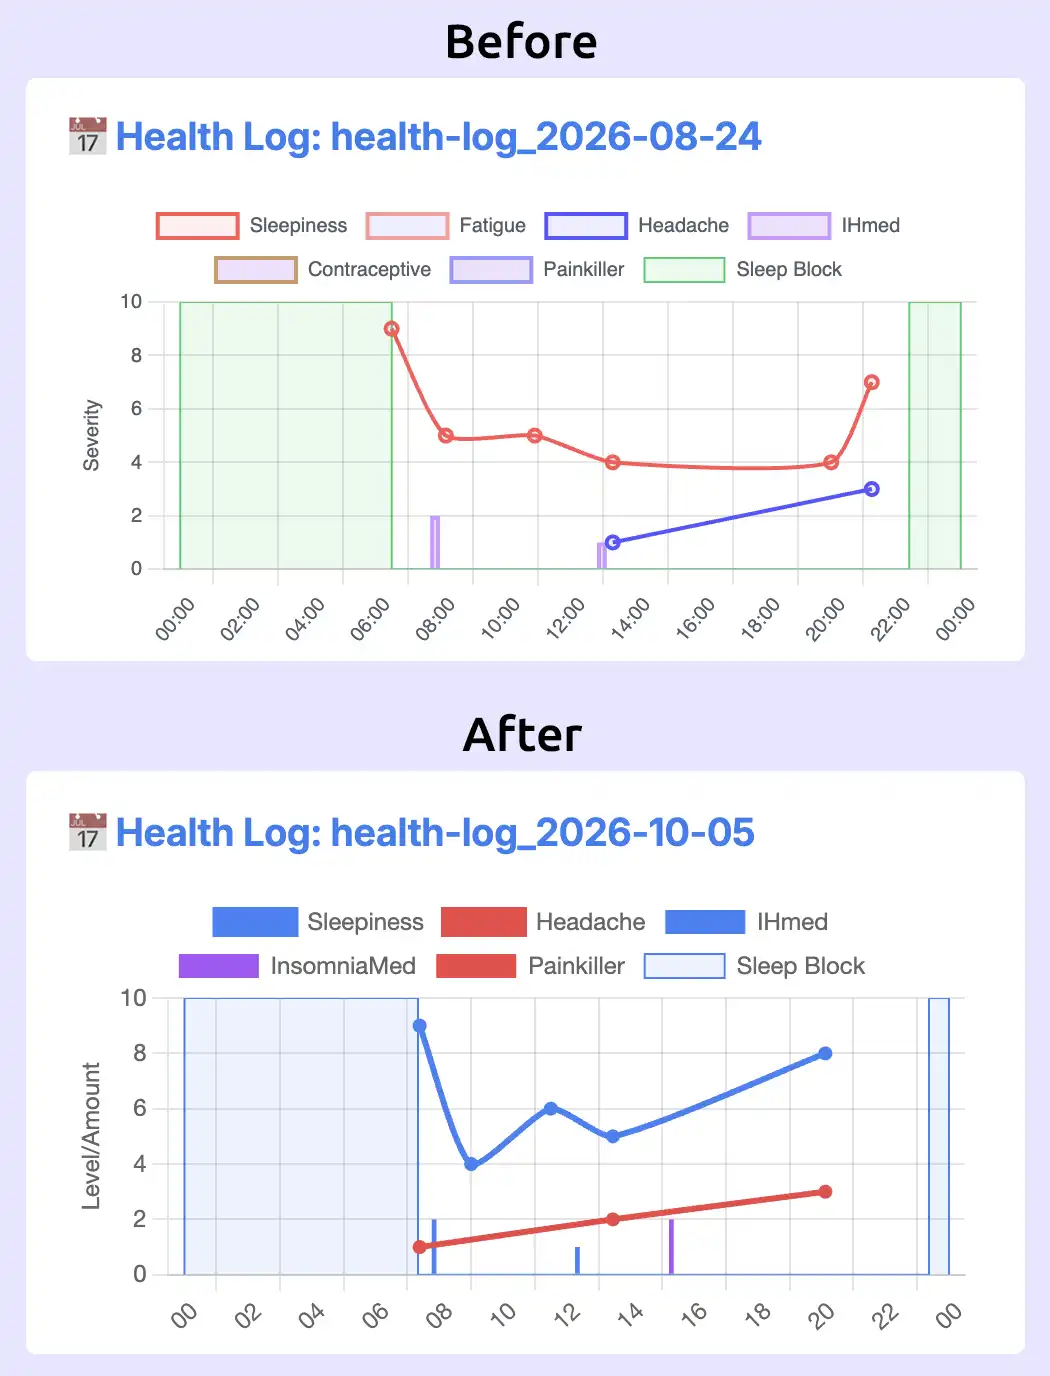
The current version of the health-log_YYYY-MM-DD.md and Health-chart_YYYY-MM-DD.md look like these:
health-log_YYYY-MM-DD.md
---
WakeUp: 07:00
Waking up during the night: 06:00 (micturition desire)
Sleep Hours: 8.25
BedIn: 22:00
SleepIn: 22:03
Menstruation (quantity 1-5): 1
Note: I walked a lot today, and fell asleep almost instantly.
---

# health-log_YYYY-MM-DD.md

- Time: 07:00, Symptom: Sleepiness, Severity: 8
- Time: 07:30, Med: IHmed, Severity: 2
- Time: 09:00, Symptom: Sleepiness, Severity: 5
- Time: 12:00, Meal: Curry and rice
- Time: 12:30, Med: IHmed, Severity: 1
- Time: 12:30, Symptom: Sleepiness, Severity: 6
- Time: 13:00, Caffeine: Coffee, Severity: 1
- Time: 15:00, Symptom: Sleepiness, Severity: 4
- Time: 17:00, Symptom: Headache, Severity: 2
- Time: 17:20, Med: Painkiller, Severity: 1
- Time: 20:00, Symptom: Sleepiness, Severity: 6
- Time: 22:00, Med: InsomniaMed, Severity: 2
Health-chart_YYYY-MM-DD.md
const colorPalette = {
    Sleepiness: '#3b82f6',
    SleepBlockFill: 'rgb(59, 130, 246,.1)',
    IHmed: '#3b82f6',
    Headache: '#ef4444',
    Painkiller: '#ef4444',
    InsomniaMed: '#a855f7',
};


// 1. Fetch all daily logs, sorted chronologically
const pages = dv.pages('"Health Log"').sort(p => p.file.name, 'asc');

// FILTER: Get only the current month and year
const targetMonth = "health-log_2026-11";
const monthlyPages = pages.filter(p => p.file.name.startsWith(targetMonth));

// 2. Loop through each individual day found in that month
for (let i = 0; i < monthlyPages.length; i++) {
    const page = monthlyPages[i];
    const dateStr = page.file.name;

    // Create a unique dataset container for THIS specific day row
    let timelineMap = {};
    let sleepDataCoordinates = [];

    // Calculate historical lookback sleep duration limits safely
    let BedInTime = null;
    let wakeUpTime = null;

    if (page.WakeUp) {
        wakeUpTime = page.WakeUp;
        BedInTime = page.BedIn;
    }

    // Map the local sleep boundaries for this specific chart row
    if (BedInTime) {
        sleepDataCoordinates.push({ x: "00:00", y: 0 });
        sleepDataCoordinates.push({ x: BedInTime, y: 0 });
        sleepDataCoordinates.push({ x: BedInTime, y: 10 });
        sleepDataCoordinates.push({ x: "24:00", y: 10 });
    }
    if (wakeUpTime) {
        sleepDataCoordinates.push({ x: "00:00", y: 10 });
        sleepDataCoordinates.push({ x: wakeUpTime, y: 10 });
        sleepDataCoordinates.push({ x: wakeUpTime, y: 0 });
        sleepDataCoordinates.push({ x: "24:00", y: 0 });
    }

    // Process bullet points belonging strictly to this day's file
    let dayHasData = false;
    for (let item of page.file.lists) {
        const text = item.text;
        const timeMatch = text.match(/Time:\s*(\d{2}:\d{2})/);
        const severityMatch = text.match(/Severity:\s*(\d+)/);

        if (timeMatch && severityMatch) {
            const timeStr = timeMatch[1];
            const severityVal = parseInt(severityMatch[1], 10);
            dayHasData = true;

            if (!timelineMap[timeStr]) {
                timelineMap[timeStr] = {
                    Sleepiness: null,
                    Headache: null,
                    // Fatigue: null,
                    IHmed: null,
                    InsomniaMed: null,
                    Contraceptive: null,
                    Painkiller: null };
            }

            if (text.includes("Symptom: Sleepiness")) {
                timelineMap[timeStr].Sleepiness = severityVal;
            } else if (text.includes("Symptom: Headache")) {
                timelineMap[timeStr].Headache = severityVal;
            } else if (text.includes("Med: IHmed")) {
                timelineMap[timeStr].IHmed = severityVal;
            } else if (text.includes("Med: InsomniaMed")) {
                timelineMap[timeStr].InsomniaMed = severityVal;
            } else if (text.includes("Med: Painkiller")) {
                timelineMap[timeStr].Painkiller = severityVal;
            }
        }
    }

    // Skip rendering entirely if the day has no symptom entries and no sleep data
    if (!dayHasData && sleepDataCoordinates.length === 0) continue;

    // 3. Extract and sort map entries for this specific line block
    const sortedTimes = Object.keys(timelineMap).sort();
    const SleepinessData = sortedTimes.map(t => timelineMap[t].Sleepiness);
    const HeadacheData = sortedTimes.map(t => timelineMap[t].Headache);
    const IHmedData = sortedTimes.map(t => timelineMap[t].IHmed);
    const InsomniaMedData = sortedTimes.map(t => timelineMap[t].InsomniaMed);
    const PainkillerData = sortedTimes.map(t => timelineMap[t].Painkiller);
    sleepDataCoordinates.sort((a, b) => a.x.localeCompare(b.x));

    // 4. Output a clean Markdown header split for this row item
    this.container.createEl("h3", { text: `📅 Health Log: ${dateStr}` });

    // Create a unique wrapper element for this specific canvas instance
    const chartContainer = this.container.createEl("div");

    // 5. Render individual chart row onto the newly generated container element
    const chartData = {
        type: 'line',
        backgroundOpacity: 0.1,
        borderWidth: 2,
        data: {
            labels: sortedTimes,
            datasets: [
                {
                    label: 'Sleepiness',
                    data: SleepinessData,
                    yAxisID: 'ySym',
                    borderColor: colorPalette.Sleepiness,
                    backgroundColor: colorPalette.Sleepiness,
                    tension: 0.2,
                    spanGaps: true
                },
                {
                    label: 'Headache',
                    data: HeadacheData,
                    yAxisID: 'ySym',
                    borderColor: colorPalette.Headache,
                    backgroundColor: colorPalette.Headache,
                    tension: 0.2,
                    spanGaps: true
                },
                {
                    type: 'bar',
                    label: 'IHmed',
                    data: IHmedData,
                    yAxisID: 'ySym',
                    borderColor: colorPalette.IHmed,
                    backgroundColor: colorPalette.IHmed,
                    spanGaps: true
                },
                {
                    type: 'bar',
                    label: 'InsomniaMed',
                    data: InsomniaMedData,
                    yAxisID: 'ySym',
                    borderColor: colorPalette.InsomniaMed,
                    backgroundColor: colorPalette.InsomniaMed,
                    spanGaps: true
                },
                {
                    type: 'bar',
                    label: 'Painkiller',
                    data: PainkillerData,
                    yAxisID: 'ySym',
                    borderColor: colorPalette.Painkiller,
                    backgroundColor: colorPalette.Painkiller,
                    spanGaps: true
                },
                {
                    label: 'Sleep Block',
                    data: sleepDataCoordinates,
                    yAxisID: 'ySym',
                    borderColor: colorPalette.Sleepiness,
                    backgroundColor: colorPalette.SleepBlockFill,
                    borderWidth: 1,
                    fill: true,
                    pointRadius: 0
                }
            ]
        },
        options: {
            responsive: true,
            scales: {
                ySym: {
                    type: 'linear',
                    position: 'left',
                    title: { display: true, text: 'Level/Amount' },
                    min: 0,
                    max: 10
                },
                x: {
                    type: 'time',
                    time: {
                        parser: 'HH:mm',
                        unit: 'hour',
                        displayFormats: { hour: 'HH' }
                    },
                    min: '00:00',
                    max: '24:00'
                }
            }
        }
    };

    window.renderChart(chartData, chartContainer);
}
What I want to change/might change in the future
It might sound stupid, but I found myself manually calculating the average sleep duration of the month once every few days. This is to understand my ideal sleep hours, but it should be automated either by adding a special row to the Dataview table or by integrating this non-chart part with a spreadsheet.
4. Closing (UX/feature/design priority)
Since I started to log things in this system, my sleep hygiene has significantly improved. Now I know my minimum sleep duration to stay functioning is 7.5 hours, and 8 is ideal. After a week of protecting my sleep hours, the severity of daytime sleepiness has decreased. I still feel sleepy when my hypersomnia medicine loses its effect. My nighttime insomnia has not gone yet, but even when I only slept for 5 hours, I don’t feel like a zombie anymore.
To mention a female thing, I also found how hormonal changes affect my hypersomnia symptoms. I used to think that there is no correlation between them, because bad days randomly came. However, after I stabilized my sleep, I could see how my daytime sleepiness increased as the period approaches. Now I’m able to predict when I should slow down to protect my health. This was a huge bonus.
Why not choose an existing app?
The reason why I chose a DIY method is simple… My needs were too niche. I found no app that targeted daytime sleepiness. Even Apple Health didn’t have this category.
Footnotes
-
In Japan, the prevalence is 7.7 per 100,000 people (0.0077%), while reports from other countries indicate a prevalence of 7.8–14.6 per 100,000 people. Source: イラストでわかる特発性過眠症 (Idiopathic Hypersomnia explained with illustrations) ↩
-
I’m personally sick about YouTubers using this term to romanticize deep focus. Hyperfocus is not fancy. It’s a double-edged sword somewhat similar to brainrot. They are both uncontrollable. ↩
-
This state is called Sleep Drunkenness. ↩
-
Currently, I use Syncthing on Mac and Windows, and Synctrain for iOS. I also used the official Obsidian Sync in the past, and it was very reliable. ↩
-
It might sound weird to have hypersomnia and insomnia at the same time. It’s even more weird when my natural sleep latency is around 1.5 minute according to MSLT (while the diagnostic criteria is “less than 8 minutes”). But actually, the type of insomnia I experience is common among autistic people. A part of my brain is just unable to calm down when the other parts are ready to shut down. Just like how my brain needs an external force to switch focus, I need the same when it refuses to unwind. ↩